
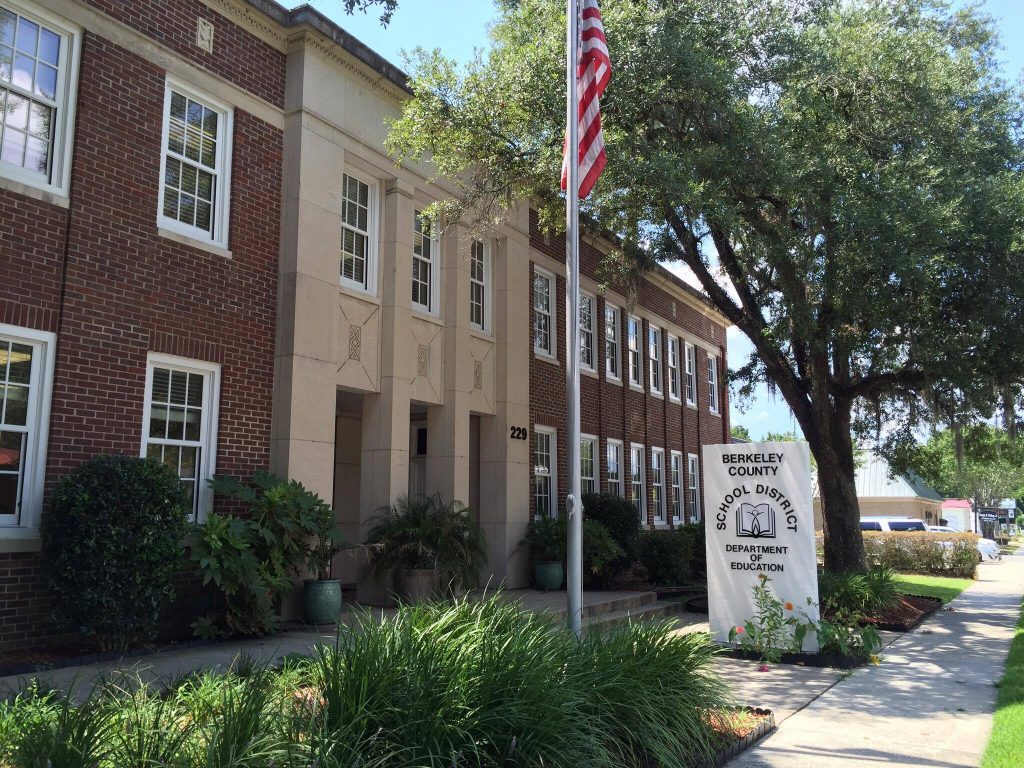
BERKELEY COUNTY, S.C. – The SC Department of Education and the SC Education Oversight Committee released the 2022 School Report Cards this week, the first cards to contain ratings since 2019.
The report cards, available at www.screportcards.com, reflect data elements and student performance information from the 2021-22 school year.
The cards and ratings are designed to increase accessibility and accountability in South Carolina’s public schools by providing easy-to-understand/use information for families and the general public.
Statewide, 20.6 percent of schools received an overall rating of “excellent,” consistent with the 2019 percent of schools receiving the highest rating in the state’s education accountability system, according to SCDE.
With over 230,000 residents in 2020 and a 27.8 percent population increase since 2010 (177,843 residents), the Berkeley County community remains one of the fastest-growing counties in South Carolina.
The district’s overall yearly enrollment also continues to climb, adding an average of 1,000 students to the system each school year, BCSD officials said.
“The district and community have worked diligently to ensure that the focus continues to be on student learning and safety, along with meeting the social-emotional needs of our children and staff,” the school district notes on its report card overview.
Below, you’ll find what some of the 2022 school report card data showed for Berkeley County public schools. To read the school district’s report card in its entirety, click here.
GRADUATION RATE
| BERKELEY COUNTY | 84.3% (2215 / 2629) |
| STATE | 83.8% (49072 / 58534) |
The Berkeley County School District saw a small improvement in its 2022 graduation rate from the previous year. It’s also slightly higher than the statewide average.
The percentage of BCSD students meeting or exceeding goals in SC Ready English Language Arts is 44.6% – two percentage points lower than the statewide average. The school district also performed slightly lower than the statewide average in math.
ENGLISH LANGUAGE ARTS (Reading and Writing) – Percent Met or Exceeding
| BERKELEY COUNTY | 44.6% (7091 / 15892) |
| STATE | 46.6% (160707 / 344866) |
MATHEMATICS – Percent Met or Exceeding
| BERKELEY COUNTY | 31.7% (5045 / 15893) |
| STATE | 38.9% (134048 / 344866) |
ASSESSMENT RESULTS (The SAT)
The SAT is a standardized test often used in the college admissions process. Its’ aim is to assess the student’s readiness for college. The current test consists of two 800-point sections testing Evidence-Based Reading and Writing (ERW) and Mathematics.
| Percent of Students Tested | Average Evidence-Based Reading and Writing Score | Average Math Score | Average Composite Score | |
|---|---|---|---|---|
| BERKELEY COUNTY | 33.5 | 518 | 492 | 1011 |
| STATE | 48.8 | 522 | 501 | 1023 |
For the first time this year, schools received a rating for “school climate.” The measure uses results from the teacher and student climate surveys to measure perceptions of safety, working conditions, and the social-physical environment.
OVERALL PERCEPTIONS OF SCHOOL CLIMATE (ENVIRONMENT)
| BERKELEY COUNTY | (5.78 / 10) |
| STATE | (6.33 / 10) |
STUDENT SAFETY
Unsafe Incident Information as reported in the 2021-2022 Incident Management System (IMS)
| Number of Incidents | |
|---|---|
| Have there been any incidents involving a firearm? | Yes |
| Was a homicide committed at your school? | No |
| Incidents of rape or attempted rape | 0 |
| Incidents of sexual assault (not rape) | 1 |
| Incidents of robbery w/ weapon | 0 |
| Incidents of robbery w/ firearm or explosive | 0 |
| Incidents of robbery w/out weapon | 0 |
| Incidents of physical attack w/ weapon | 0 |
| Incidents of physical attack w/ firearm or explosive | 0 |
| Incidents of physical attack w/out weapon | 95 |
| Incidents of threats of physical attack w/ weapon | 3 |
| Incidents of threats of physical attack w/ firearm or explosive | 0 |
| Incidents of threats of physical attack w/out weapon | 390 |
| Incidents of possession of firearm or explosive | 8 |
| Students with in-school suspensions | 4066 |
| Students with out of school suspensions | 3688 |
| Students expelled | 247 |
| School related arrests and referrals to law enforcement | 463 |
| Incidents of bullying and harassment | 48 |
FINANCIAL DATA
| Berkeley County | Change from Prev Year | |
|---|---|---|
| Average teacher salary | $55,455 | Up from $52,022 |
| Percent of expenditures for instruction | 53.9 | Up from 52.9 |
| Percent of expenditures for teacher salaries | 48.6 | Up from 48 |
| Average administrator salary | $96,964 | Up from $96,392 |
| Percent of students in poverty (TANF, Medicaid, SNAP, foster child, homeless or migrant) | 55.8 | Down from 57.3 |
| Prior fiscal year State & Local Personnel Per Pupil Expenditure | $7,935 | Up from 6260 |
| Prior fiscal year Federal Personnel Per Pupil Expenditure | $553 | Up from 383 |
| Prior fiscal year State & Local Non-Personnel Per Pupil Expenditure | $1,323 | Up from 314 |
| Prior fiscal year Federal Non-Personnel Per Pupil Expenditure | $541 | Up from 222 |
| Prior fiscal year Total State & Local Per Pupil Expenditure | $9,258 | Up from 6574 |
| Prior fiscal year Total Federal Per Pupil Expenditure | $1,094 | Up from 605 |
| Prior fiscal year Total Per Pupil Expenditure | $10,353 | Up from 7178 |
The School Report Cards, which are based on South Carolina’s education accountability system, are required for all elementary, middle, and high schools which receive overall ratings based on a 100-point scale.
The ratings follow terms outlined in state law: Excellent, Good, Average, Below Average, and Unsatisfactory. Schools also receive ratings on various indicators, such as graduation rate, academic achievement, and college and career-readiness.


Recent Comments